Category
Data ArchitectureAbout This Project
Mapping Progress for HIV Caseload Reduction Policy Implementation
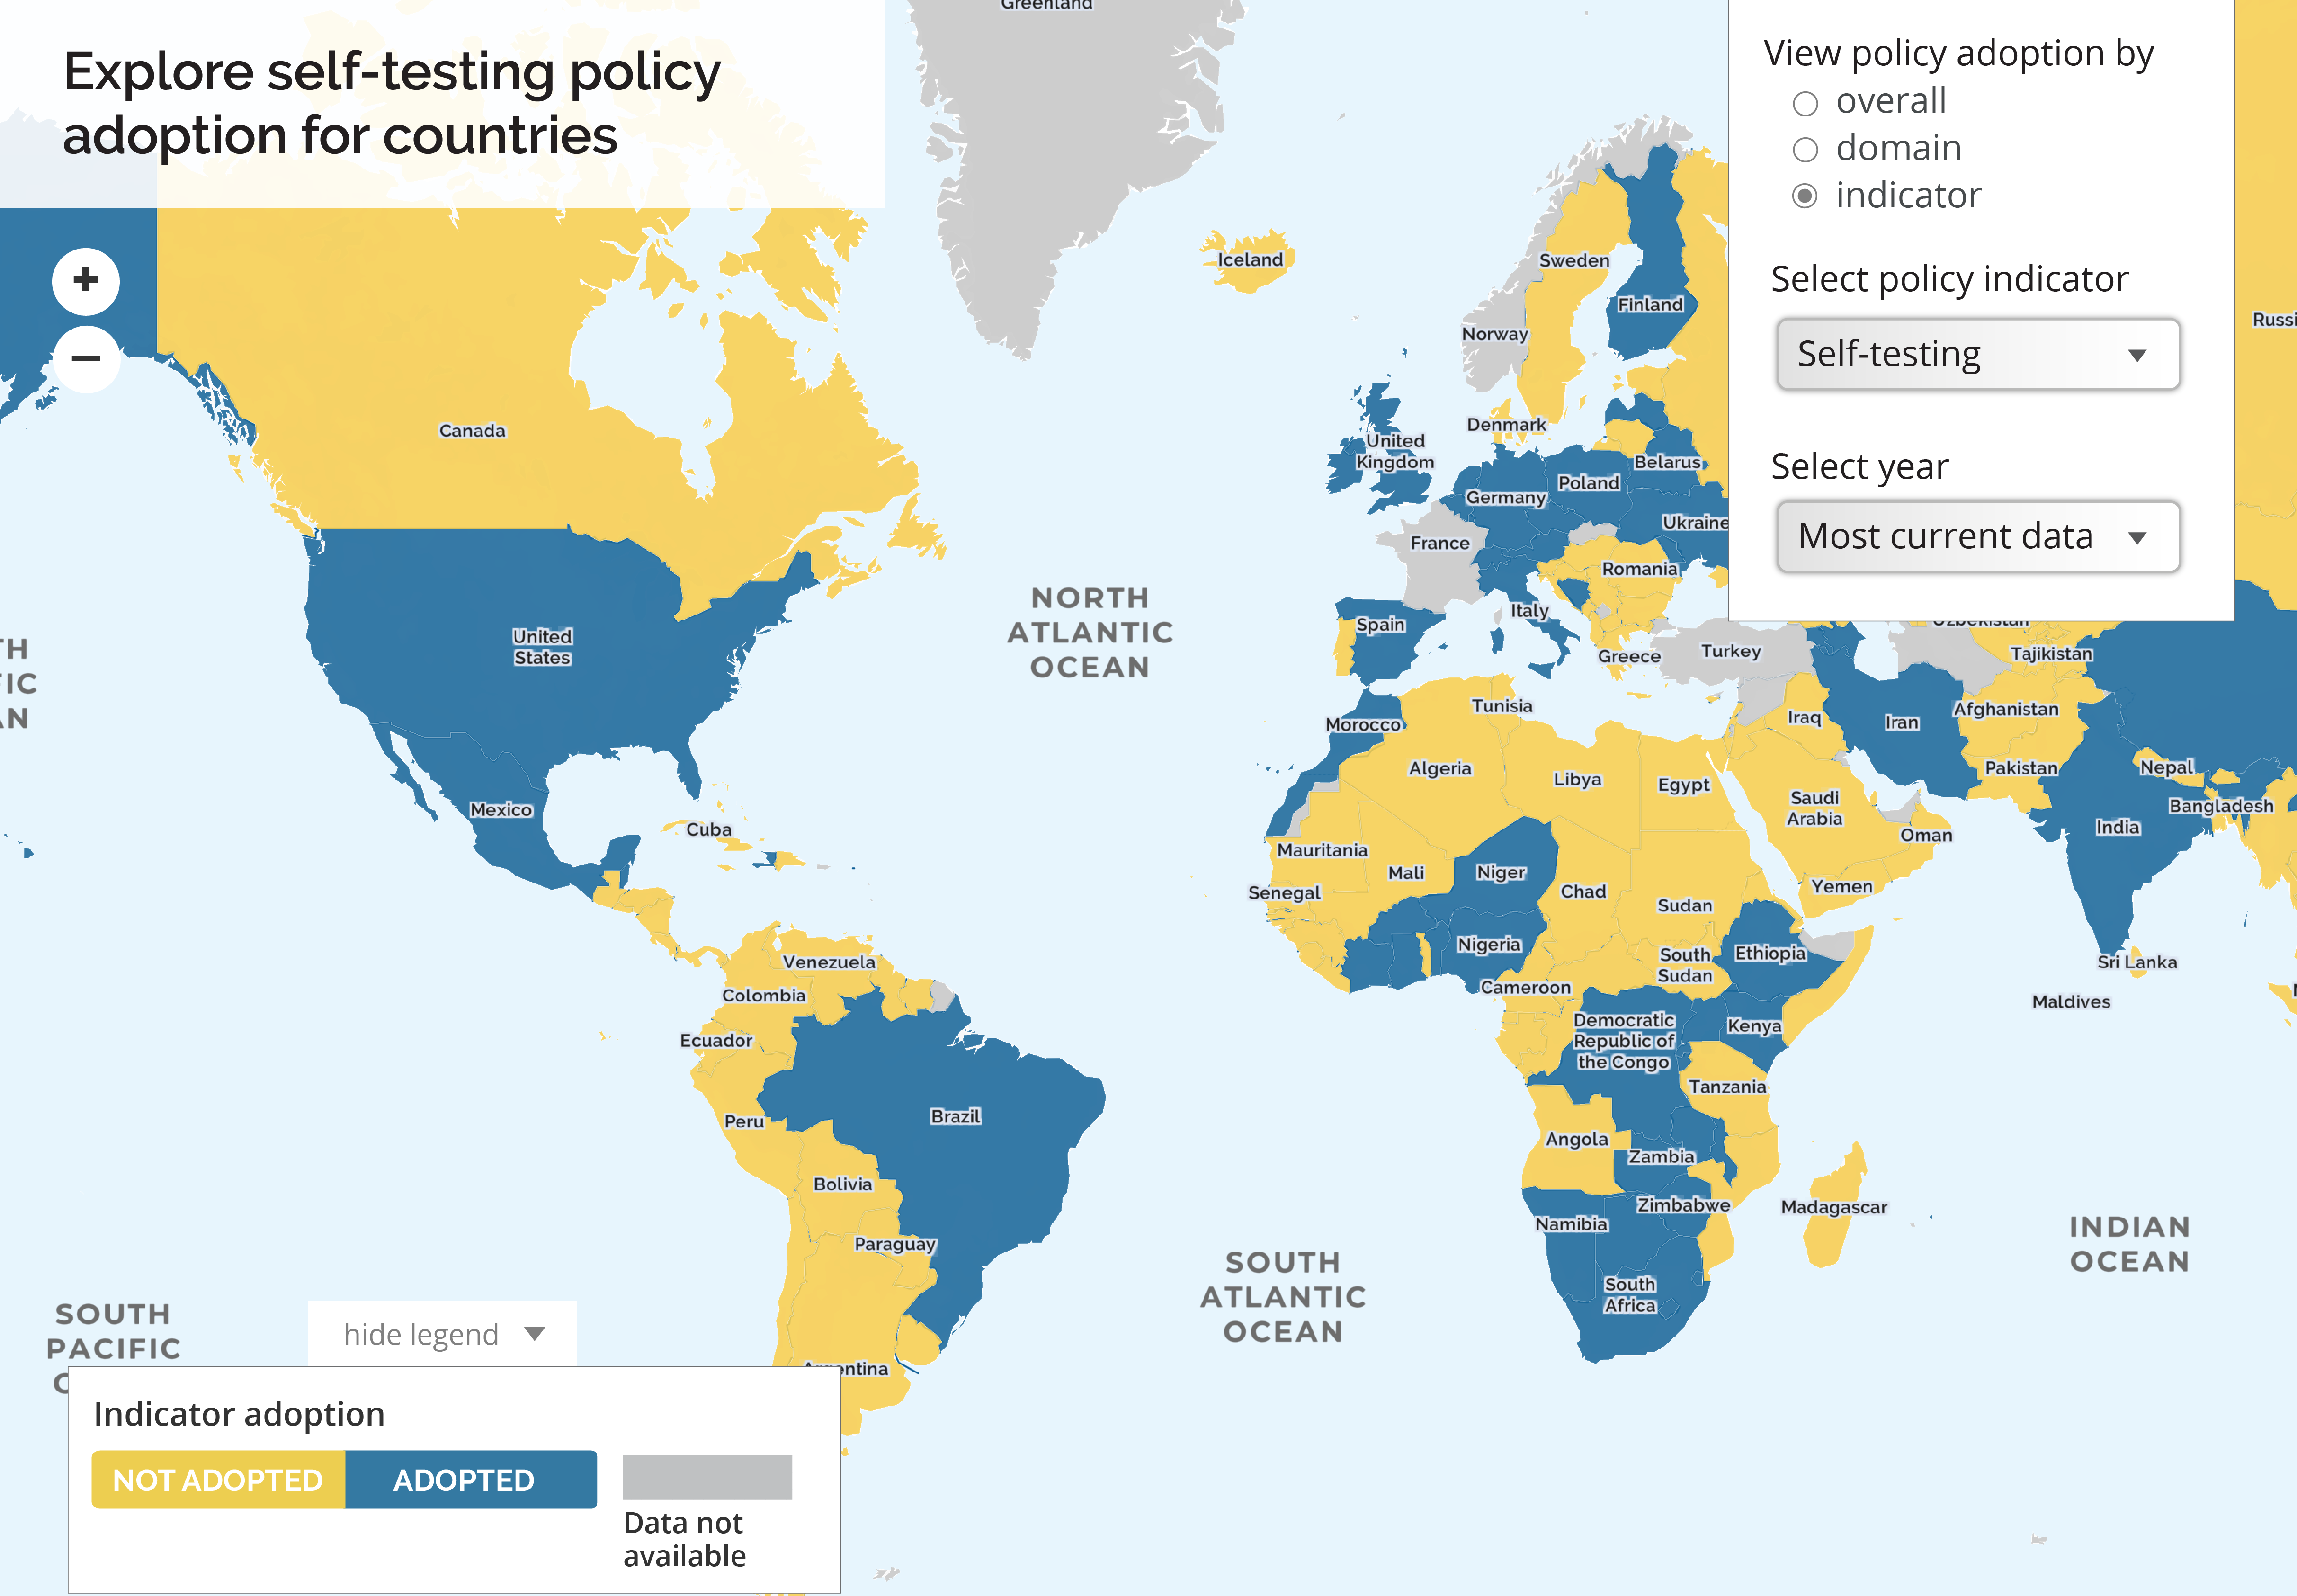
Interactive map of global progress towardimplementation of HIV caseload reduction policies.
PROJECT TYPE(S)
Partner(s)
O’Neill Institute for National and Global Health Law Georgetown University Law Center
HIV caseload reduction is a major focus of health policy globally. However, there is no existing metric capturing progress toward implementation of policies globally that support this goal, nor a mechanism to assess whether that implementation has had an impact on caseload. In a collaborative effort with the O’Neill Institute for National and Global Health Law at Georgetown University Law Center and the Georgetown University Center for Global Health Science and Security, with support from UNAIDS and PEPFAR, we have launched a project to address this gap.
As part of the HIV Policy Lab, Talus has developed an integrated data architecture and both qualitative and quantitative metrics to assess global policy implementation across ~30 key areas targeting HIV caseload reduction. We have built a custom visualization platform to communicate these metrics geospatially, with the ability to assess overall progress toward implementation, progress in each of four overarching policy domains (groups of related policies), and by specific policy type. The interactive tool, available online either on a desktop or mobile platform, was developed in Python, JavaScript, and HTML, and provides rapid access to key visualizations of the metrics globally and by country over time. Additional analyses evaluating the correlation of policy implementation with caseload will be added within the next year.
As part of the HIV Policy Lab, Talus has developed an integrated data architecture and both qualitative and quantitative metrics to assess global policy implementation across ~30 key areas targeting HIV caseload reduction. We have built a custom visualization platform to communicate these metrics geospatially, with the ability to assess overall progress toward implementation, progress in each of four overarching policy domains (groups of related policies), and by specific policy type. The interactive tool, available online either on a desktop or mobile platform, was developed in Python, JavaScript, and HTML, and provides rapid access to key visualizations of the metrics globally and by country over time. Additional analyses evaluating the correlation of policy implementation with caseload will be added within the next year.