Category
Public Health, Risk AnalysisAbout This Project
Flu Vaccination Dashboard
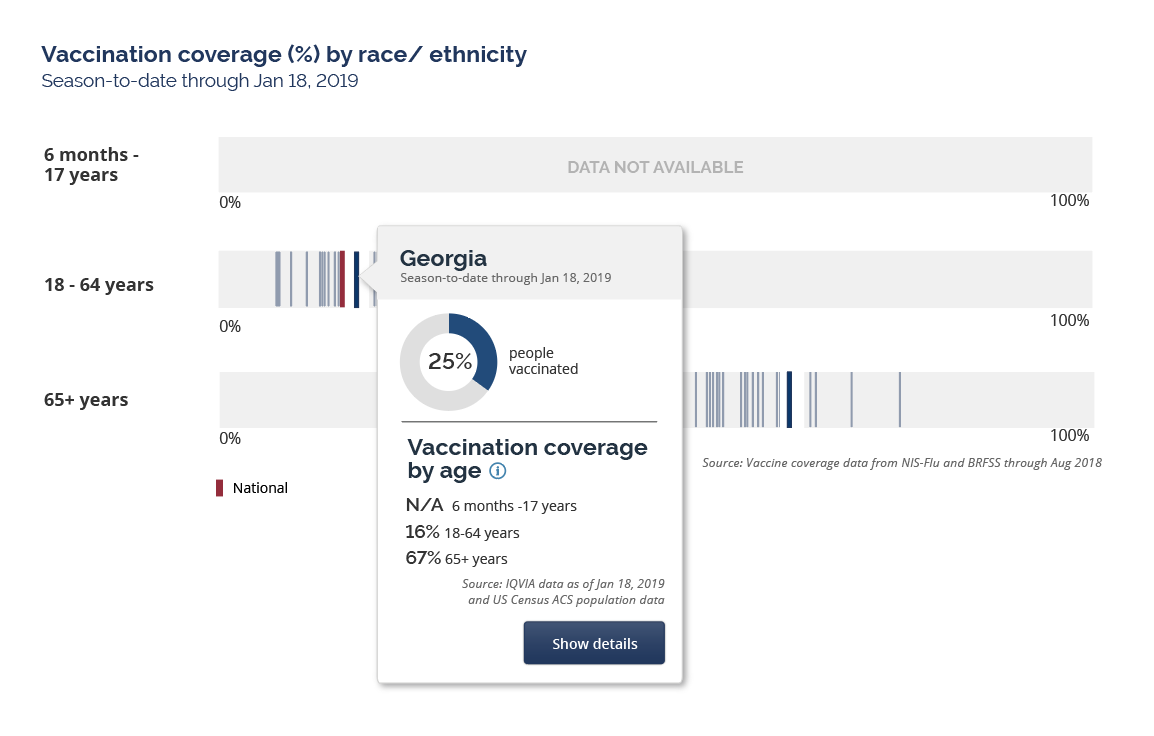
A visual of vaccination coverage by age group
PROJECT TYPE(S)
Partner(s)
Center for Disease Control
Talus Analytics has worked in close in collaboration with the Association of State and Tribal Health Officials (ASTHO) on behalf of the Centers for Disease Control and Prevention’s National Center for Immunization and Respiratory Diseases (CDC NCIRD) to develop a vaccination uptake dashboard providing situational awareness on influenza vaccination efforts.
The dashboard provides integration and visualization of near-real-time influenza vaccination coverage information, referenced against caseload and demographics. This dashboard is used by CDC leadership to guide vaccination efforts, public messaging, and better understand uptake of the vaccine at the state and Federal levels. To support this effort, Talus developed both custom data ingest methods and the visualization platform to dynamically communicate these data at a weekly resolution for all US states, the District of Columbia, and for US territories. Data are shown for the current flu season and prior flu seasons to allow comparisons across time. As vaccination coverage data are collected via a wide range of mechanisms including phone and internet panel surveys, claims data, and electronic medical record (EMR) data, the dashboard integrates sources with reference to their corresponding sample sizes (e.g., the number of persons included in the survey) and confidence intervals (e.g., a 95% confidence interval for the % of the population vaccinated). To assess whether vaccines have effectively reached specific and high-risk populations, vaccination coverage data are disaggregated across age groups, by race/ethnicity, and for pregnant women and ILI activity data are included to identify states that might benefit most from additional vaccination efforts. To understand the vaccine supply chain nationally, information on vaccine distribution is tracked and compared to distribution data from prior influenza seasons.
The dashboard provides integration and visualization of near-real-time influenza vaccination coverage information, referenced against caseload and demographics. This dashboard is used by CDC leadership to guide vaccination efforts, public messaging, and better understand uptake of the vaccine at the state and Federal levels. To support this effort, Talus developed both custom data ingest methods and the visualization platform to dynamically communicate these data at a weekly resolution for all US states, the District of Columbia, and for US territories. Data are shown for the current flu season and prior flu seasons to allow comparisons across time. As vaccination coverage data are collected via a wide range of mechanisms including phone and internet panel surveys, claims data, and electronic medical record (EMR) data, the dashboard integrates sources with reference to their corresponding sample sizes (e.g., the number of persons included in the survey) and confidence intervals (e.g., a 95% confidence interval for the % of the population vaccinated). To assess whether vaccines have effectively reached specific and high-risk populations, vaccination coverage data are disaggregated across age groups, by race/ethnicity, and for pregnant women and ILI activity data are included to identify states that might benefit most from additional vaccination efforts. To understand the vaccine supply chain nationally, information on vaccine distribution is tracked and compared to distribution data from prior influenza seasons.